Westgard Rules Calculator & Levey-Jennings Chart
Paste a series of QC results, set the mean and standard deviation, and see exactly which Westgard multi-rules fire — plotted on a Levey-Jennings chart. Runs entirely in your browser; nothing is uploaded or stored.
What this Westgard rules calculator does
The Westgard rules are a multi-rule quality-control system used in clinical and diagnostic laboratories to decide whether an analytical run is in control. Rather than rejecting a run every time a single control wobbles, the rules work together so you catch genuine random and systematic error without drowning in false rejections. This free tool evaluates a series of control results against the mean and standard deviation you provide and tells you which rules — if any — were violated, alongside a Levey-Jennings chart so you can see the pattern.
The Westgard rules, in plain terms
1-2s warning
One control result falls outside the mean ±2SD. On its own this is a warning, not a rejection — about 1 in 20 good results land here by chance. It's the trigger to check the other rules.
1-3s
One control result falls outside the mean ±3SD. This is a rejection — a result this far out usually signals random error such as a bubble, a bad aliquot or a one-off analyser fault.
2-2s
Two consecutive results fall outside the same ±2SD limit (both high or both low). A classic signature of systematic error — a calibration shift, a reagent lot change or drift.
R-4s
Two consecutive results span more than 4SD with opposite signs (one beyond +2SD, the other beyond −2SD). The controls diverge in opposite directions, pointing to random error / loss of precision.
4-1s
Four consecutive results fall outside the same ±1SD limit. None is dramatic alone, but four in a row on one side is a clear systematic drift.
10x
Ten consecutive results land on the same side of the mean. Every point can be "in range" and you still have a persistent bias the eye glides straight past.
Frequently asked questions
Are my QC values uploaded anywhere?
No. The whole calculation runs locally in your browser with JavaScript. Nothing you type is sent to a server or stored.
Where do the mean and SD come from?
Ideally from your established QC lot statistics (the cumulative mean and SD for that control lot and assay). If you don't have them to hand, use the Calculate mean & SD from the values below button to derive them from the data you paste — but treat that as a quick look rather than a validated baseline, since a small sample of recent points is a poor estimate of true performance.
Which interpretation of R-4s does this use?
This tool reads a single control level as a time series, so R-4s is evaluated across two consecutive points (one beyond +2SD, the next beyond −2SD, spanning >4SD). In a run with two control levels measured together, R-4s is more often applied within the run across both levels.
Is running this once enough for ISO 15189?
No — a one-off calculation isn't a QC system. An assessor wants to see QC evaluated live as results are entered, with a timestamped, attributable record of every rejection and what was done about it. That's the difference between a calculator and a platform.
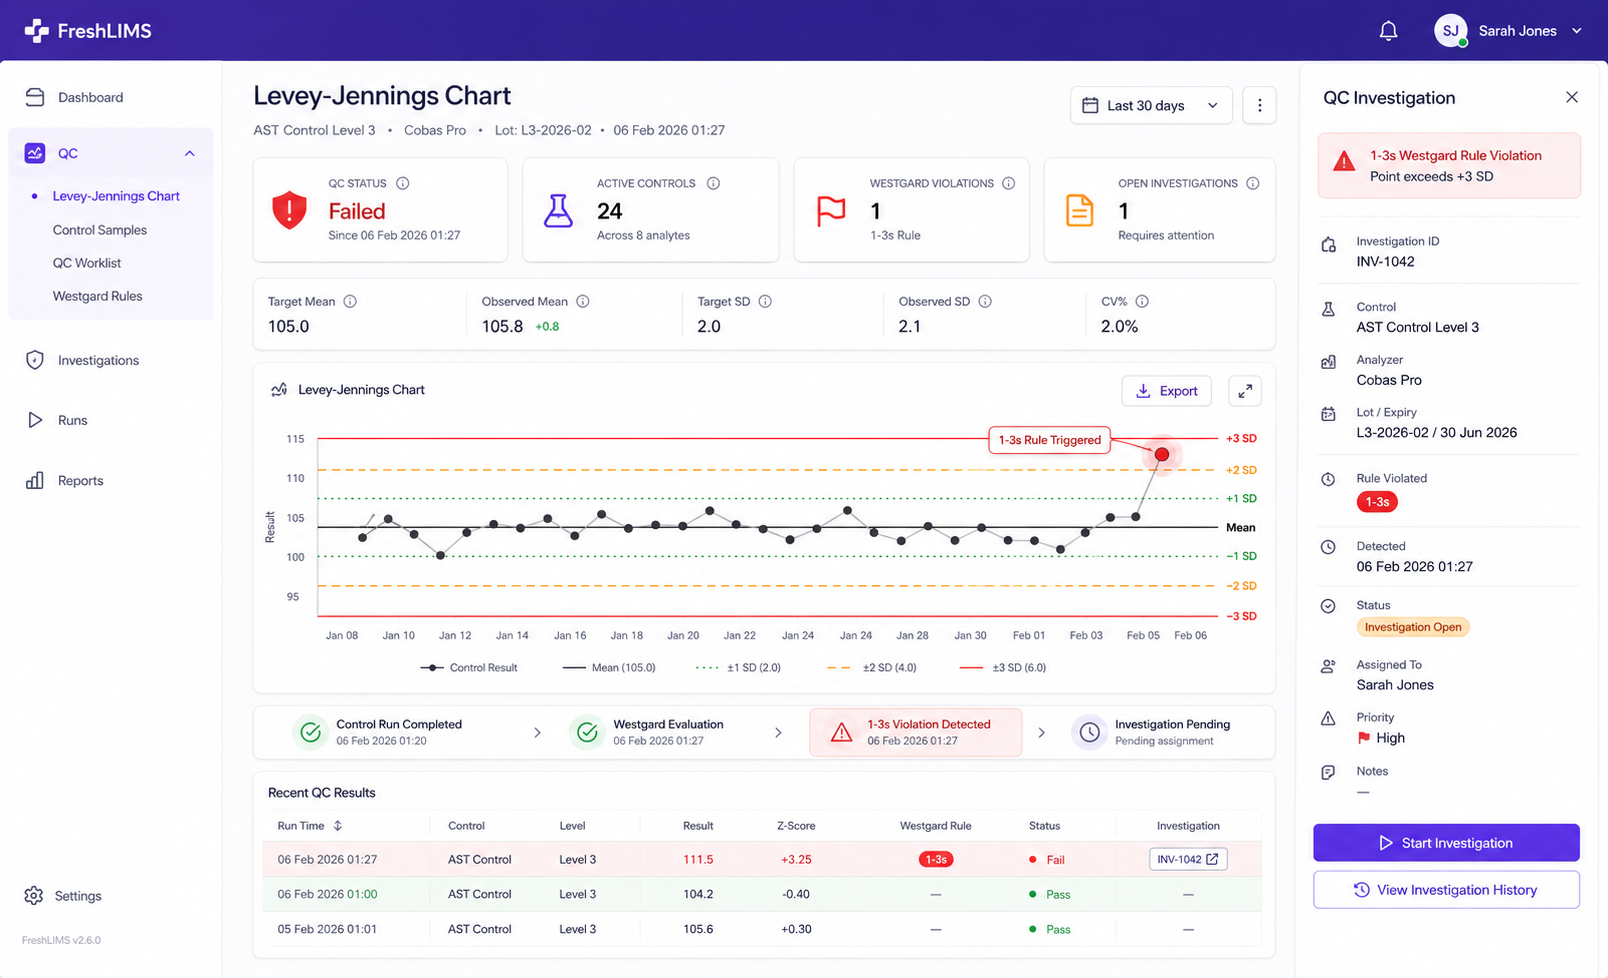
The same QC, running live in FreshLIMS
The moment a control is entered, FreshLIMS evaluates the full Westgard rule set, flags the violation on the Levey-Jennings chart, and opens a timestamped QC investigation — no spreadsheet, no month-end reconstruction.